The Iran War Reprices Global Energy as Hormuz Remains Contested
The US-Israel attack on Iran on 28 February triggered what the International Energy Agency describes as the largest oil supply disruption on record. Five months later, ceasefires have repeatedly lowered prices without restoring lasting confidence in shipping through the Strait of Hormuz.
The Iran war has become an energy-market event as much as a military conflict.
Oil, gas, electricity, freight and inflation expectations are now responding to the same question: whether commercial vessels can move safely through the Strait of Hormuz.
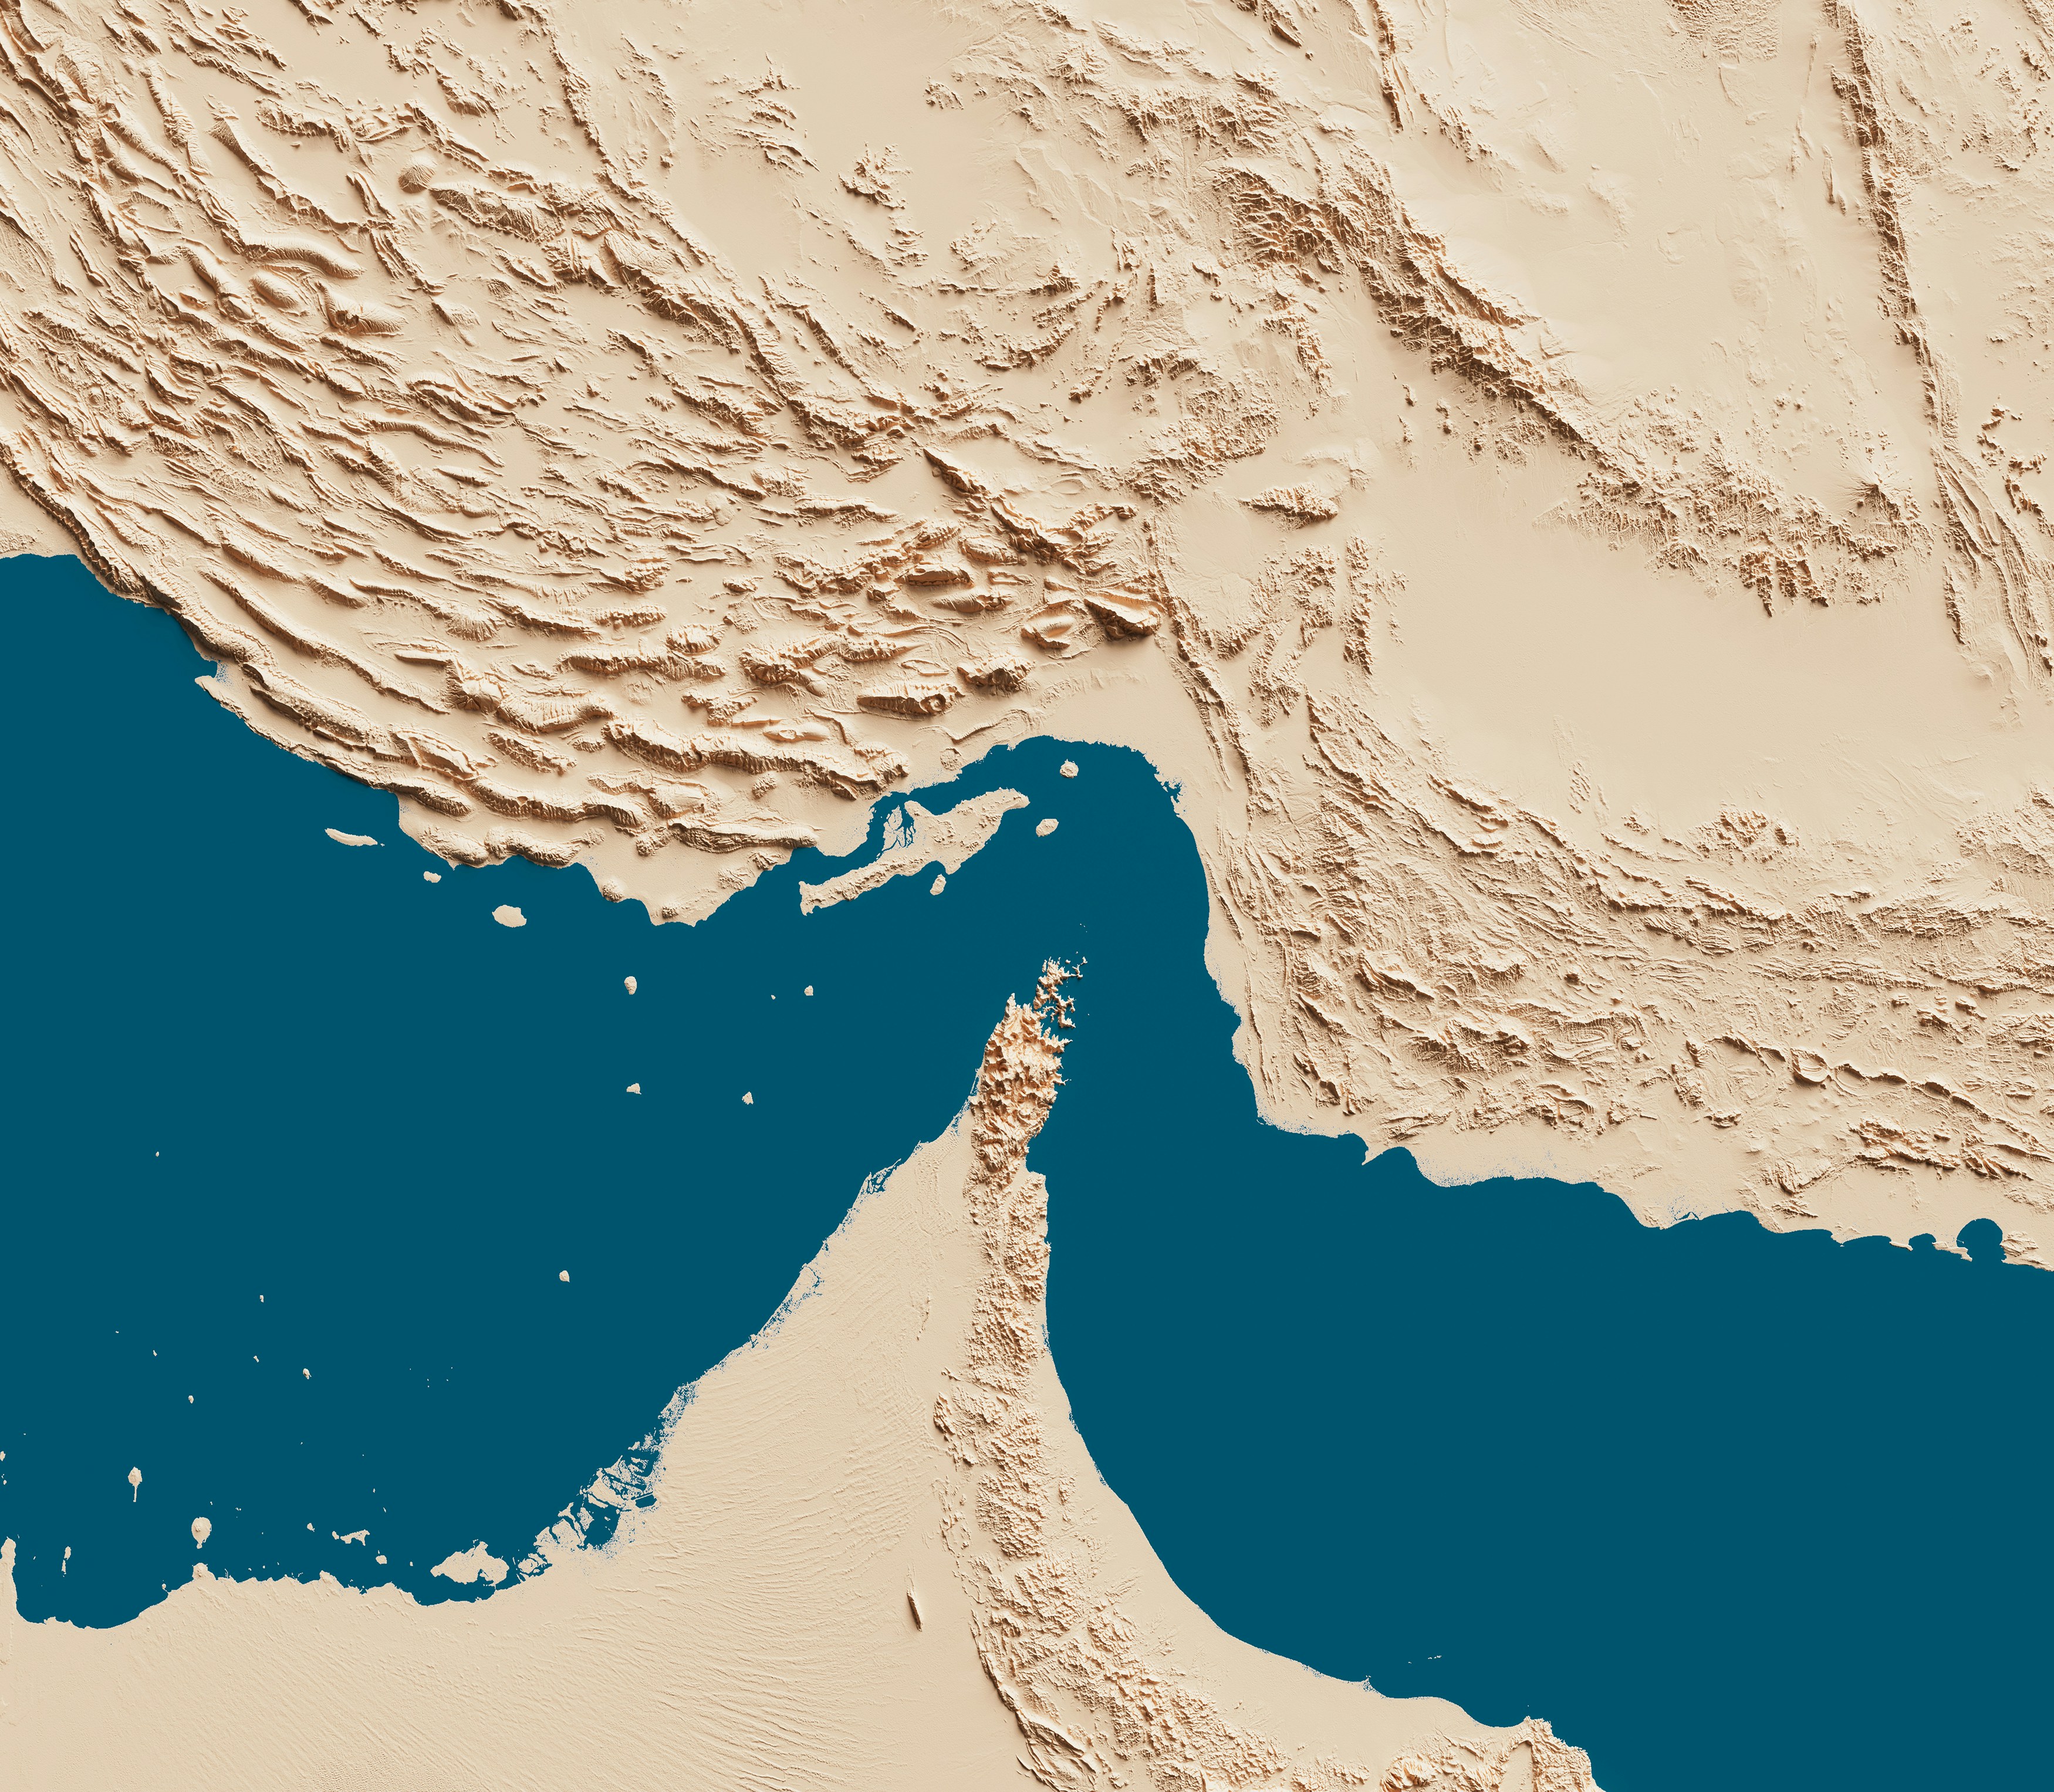
About 20 million barrels per day of petroleum liquids passed through the strait in 2024, equivalent to roughly one-fifth of global consumption and more than one-quarter of seaborne oil trade. Around one-fifth of global LNG trade also used the route, primarily exports from Qatar.
That concentration has turned a narrow waterway between Iran and Oman into the main price-setting mechanism of the war.
The conflict grows out of a collapsed nuclear settlement
The immediate war began in 2026, but its origins lie in the breakdown of the 2015 nuclear agreement.
Under that agreement, Iran accepted restrictions on its nuclear programme in return for sanctions relief. The United States withdrew from the deal on 8 May 2018 and restored sanctions. Iran subsequently reduced its compliance and, by April 2021, was enriching uranium to 60%, well above the limit contained in the original agreement.
Tensions accelerated during 2024 and 2025. Iran and Israel exchanged direct strikes in 2024, while negotiations between Washington and Tehran during April and May 2025 failed to produce a replacement nuclear agreement.
On 12 June 2025, the International Atomic Energy Agency found Iran in breach of its non-proliferation obligations. Israel attacked Iranian nuclear and military sites the following day, and the United States struck three Iranian nuclear facilities on 22 June. A ceasefire took effect on 24 June, but international sanctions were reimposed through the UN snapback process in September.
Further US-Iran talks took place on 6, 17 and 26 February 2026 against a backdrop of military deployments and growing regional tension. They ended without a settlement.
The attack on 28 February was therefore a military trigger at the end of a long diplomatic failure.
The opening strikes turn Hormuz into the central battlefield
The United States and Israel launched widespread strikes against Iran on 28 February under the US operation named Epic Fury.
Washington said its objectives included preventing Iran from obtaining a nuclear weapon, reducing its missile and naval capabilities and weakening Iran-backed armed groups. US officials also said Israel’s planned attack had precipitated the American decision to strike. Iran described the operation as illegal and unprovoked.
The initial attacks killed Supreme Leader Ali Khamenei and a number of senior Iranian military and political figures. Iran retaliated against Israel, US positions and targets elsewhere in the Gulf.
Tehran also moved to restrict commercial passage through the Strait of Hormuz. Hezbollah entered the conflict on 2 March, widening the fighting into Lebanon, while Mojtaba Khamenei was subsequently named Iran’s new supreme leader.
The Strait could not be fully replaced by pipelines. The US Energy Information Administration estimated that Saudi Arabia and the United Arab Emirates had only about 2.6 million barrels per day of unused pipeline capacity capable of bypassing the waterway.
From the first week, the central energy risk was not simply damage to production. It was the loss of access to production that remained physically available.
March converts geopolitical risk into physical shortage
Oil prices began the war from a relatively modest base. Brent crude closed at $72.48 a barrel on 27 February, while West Texas Intermediate closed at $67.02.
Prices then rose rapidly as tanker traffic slowed, insurance costs increased and Gulf producers reduced output that could no longer be exported reliably.
Brent reached about $119.50 during March. By 27 March, it closed at $112.57, around 53% above its pre-war close. Physical crude grades briefly traded close to $150 a barrel as buyers competed for immediately deliverable supplies.
The impact extended beyond crude oil. European gas prices rose by more than 90% during the opening weeks as Qatari LNG exports were disrupted and European buyers competed with Asia for alternative cargoes. UK natural gas moved above 143 pence per therm on 3 March, its highest level since January 2023 at that point.
The International Energy Agency coordinated its largest emergency stock release on 11 March. It later described the combined disruption to oil, gas and refined fuels as the greatest threat to global energy security in the agency’s history.
The US Energy Information Administration estimated that Gulf producers shut in around 7.5 million barrels per day during March because of export and shipping constraints.
March changed the conflict from a geopolitical risk premium into a measurable loss of supply.
April’s ceasefire cuts prices faster than it restores cargoes
A fragile two-week ceasefire began on 7 April. Direct talks in Pakistan ended without agreement on 12 April, while the United States announced a blockade of Iranian ports the following day.
Iran announced on 17 April that the Strait of Hormuz would reopen. Brent fell below $90 a barrel, while the European TTF gas benchmark dropped below €39 per megawatt-hour from more than €60 during the March peak.
The ceasefire was extended indefinitely on 21 April, but the physical energy system had not returned to normal. The EIA recorded a second-quarter Brent high of approximately $118 on 29 April, reflecting continuing uncertainty over actual export volumes and safe transit.
The difference between financial prices and physical supply became important. Futures responded immediately to diplomatic statements, while tankers, refiners and LNG terminals required evidence that routes were safe, insurable and commercially usable.
Diplomacy removed part of the risk premium, but it did not immediately restore the lost barrels and LNG cargoes.
June brings the closest point to normalisation
Fighting between Iran and Israel resumed on 7 June, but negotiations continued.
An interim agreement was announced on 14 June and signed on 17 June. It extended the April ceasefire, provided a framework for sanctions relief and called for Iran to dilute part of its highly enriched uranium stockpile. Several of the most difficult nuclear and security issues were deferred.
Markets treated the agreement as a potential route back to normal shipping.
UK natural gas fell to approximately 99.2 pence per therm on 23 June. Brent touched $73.12 on 24 June and reached a second-quarter low of around $72 on 26 June, almost completing a round trip to its pre-war level.
Equity markets also responded. European and US shares reached record levels in mid-June, while government bonds rallied and oil fell as investors reduced their inflation and supply-disruption assumptions.
The June decline showed how much of the oil price remained linked to the probability of disruption rather than the permanent loss of production capacity.
Markets priced a settlement before the shipping system had proved that one existed.
July restores the war premium
The ceasefire broke down on 7 July.
Iran was accused of attacking three commercial vessels, while the United States struck dozens of Iranian targets and reinstated sanctions. Washington later notified Congress that hostilities had formally resumed.
By 12 July, the United States said it had struck 140 targets. Iran maintained that the Strait was closed, while Washington said it remained open.
Brent rose more than 9% on 13 July to around $83.30 a barrel. The move reflected renewed concern that a partial restriction could develop into another sustained loss of Gulf exports.
Further attacks involving Houthi forces and commercial shipping pushed Brent to $100.69 on 23 July. UK natural gas reached 154.73 pence per therm on 24 July, its highest level since March and an increase of more than 60% over four weeks.
A short reduction in military activity pulled Brent back to $84.09 on 28 July. The reprieve lasted less than a day.
On 29 July, the United States and Saudi Arabia conducted joint strikes against Iran-backed groups in Iraq following drone attacks on Saudi oil facilities. Iran rejected responsibility, warned against attributing the attacks to Tehran and launched missiles towards US positions in the region.
Brent rose by more than 4% to approximately $87.81 during Wednesday trading, while WTI reached $82.69. UK natural gas moved back above 143 pence per therm after a two-day decline.
The market accepted each pause as temporary because no durable shipping arrangement had been established.
Energy prices trade military escalation and ceasefire headlines
The price record since 28 February shows a market repeatedly moving between physical scarcity and diplomatic relief.
The following levels are point-in-time market markers rather than daily averages. They are drawn from EIA, Reuters and Trading Economics data.
Date Market marker Market interpretation
27 February Brent $72.48 a barrel Final close before the opening strikes
3 March UK gas Above 143p per therm Qatari LNG disruption enters European pricing.
March peak Brent About $119.50 Hormuz restrictions create a severe war premium.
29 April Brent About $118 Second-quarter high despite ceasefire efforts
23 June UK gas About 99.2p per therm Agreement expectations reduce winter supply risk.
26 June Brent About $72 Second-quarter low and near-complete reversal
13 July Brent About $83.30 Hostilities resume and the blockade risk returns
23 July Brent $100.69 Shipping attacks and Hormuz disruption intensify
24 July UK gas 154.73p per therm European LNG competition returns to the market.
28 July Brent $84.09 Temporary military pause removes part of the premium
29 July Brent About $87.81; UK gas: above 143p Joint US-Saudi strikes restart escalation risk.
The range is unusually wide. The EIA calculated that Brent moved between approximately $72 and $118 during the second quarter alone, while average daily price changes during April and May were four times their level a year earlier.
The dominant trading signal has been access to Hormuz, not a stable assessment of long-term demand.
LNG disruption carries the conflict into European gas prices
Europe’s direct exposure is concentrated in LNG.
The IEA estimated that LNG supply from Qatar and the United Arab Emirates fell by more than 300 million cubic metres per day after 1 March. That represented a loss of more than two billion cubic metres each week.
Qatar is one of the world’s largest LNG exporters, and its cargoes must pass through the Strait of Hormuz. QatarEnergy has extended force majeure for some European buyers into September, with some shipping arrangements potentially affected into October. Italian utility Edison said force majeure affecting three European cargoes had been extended to the end of September.
Europe is attempting to rebuild gas storage before winter while competing with Asian utilities for replacement cargoes. Asian spot LNG for September delivery reached about $22 per million British thermal units, a four-month high, increasing the price required to redirect supply towards Europe.
The next European gas surge does not require a complete closure of Hormuz. A sustained reduction in Qatari loading, higher tanker insurance or a longer voyage around disrupted routes would be sufficient to tighten the winter balance.
Europe’s risk is therefore determined by available cargoes, not simply the amount of gas held underground.
Ireland imports the shock through gas and electricity markets
The UK gas benchmark matters to Irish businesses because Ireland’s wholesale gas market closely follows the GB market. Interconnector and transmission costs create an additional premium for delivering that gas into Ireland.
The connection extends into electricity pricing.
EirGrid reported that gas-fired generation supplied 40% of the electricity used in Ireland during June 2026. In the all-island Single Electricity Market, the wholesale electricity price is normally set by the most expensive generator required to meet demand, which is frequently a gas-fired plant.
When wholesale gas rises, the cost of running those generators rises. That increase can then feed into electricity forward contracts, supplier hedging costs and renewal offers for commercial customers.
The relationship is not instantaneous or identical across every contract. Supplier hedging, contract duration, demand profile and the timing of the renewal all affect the eventual price offered.
The mechanism remains direct: a restriction on LNG and oil shipping in the Gulf can raise the cost of electricity consumed by an Irish business.
Financial markets price inflation before weaker growth
The initial market reaction was not a uniform flight from risk.
Oil, gas, the US dollar and energy shares rose, while airlines, travel companies and energy-intensive sectors came under pressure. Regional markets in the Middle East recorded sharper losses.
As the supply shock developed, investors sold both equities and government bonds. Stocks, bonds and gold fell together on 3 March as the market moved from a conventional geopolitical reaction to concern about higher inflation and tighter monetary policy.
By 26 March, the Nasdaq had entered a correction of more than 10% from its previous high. Oil was trading near $108, while government bond yields rose as investors reduced expectations for interest-rate cuts.
The June agreement reversed much of that trade. Shares and bonds rallied as oil and the dollar weakened.
July then restored the stagflation concern. Higher energy prices increased inflation expectations while raising the risk of weaker consumer demand, lower industrial margins and slower economic growth. Economists surveyed by Reuters raised inflation forecasts in 39 of 50 economies and reduced growth forecasts in 32.
The conflict trades as an inflation shock first and a growth shock second.
The energy outlook divides into three market paths
The near-term base case is continued volatility rather than an uninterrupted increase.
Partial shipping, emergency oil releases, pipeline alternatives and higher production outside the Gulf can prevent every military event from producing a new record. Analysts cited by Reuters on 29 July described an $80-to-$100 Brent range as plausible while Hormuz remains disrupted but not fully closed.
Under that path, oil and gas prices would continue to rise on attacks and fall on ceasefire announcements. UK and European gas would retain a winter premium until Qatari LNG movements and storage injections became more predictable.
A more severe escalation would involve sustained restrictions through Hormuz, further attacks on Saudi or Emirati energy infrastructure, damage to export terminals or an expansion of direct Saudi participation.
In that case, Brent above $120 would become plausible, particularly if strategic stocks could not replace lost exports quickly. European gas could retest the March TTF peak above €60 per megawatt-hour, while UK gas could move beyond July’s 154.73-pence level. These are scenario levels based on previous market reactions, not guaranteed price targets.
A durable de-escalation would require more than a ceasefire announcement. It would require verified commercial transit, lower insurance costs, renewed Qatari LNG loadings and a workable nuclear and sanctions framework.
Before the latest July escalation, the EIA projected Brent at about $74 during the third quarter and $70 during the fourth. Those figures now represent a de-escalation scenario rather than a reliable central forecast.
Until Hormuz is open, insured and commercially usable at scale, every ceasefire will remain a price event rather than a settlement.
Contract timing now carries greater commercial weight
The events since February show that attempts to identify a single market peak are unlikely to provide a reliable procurement strategy.
Businesses approaching an autumn or winter renewal face asymmetric risk. A ceasefire can reduce forward prices, but another attack on vessels, export terminals or Gulf infrastructure can restore the premium within hours.
Fixed-price contracts can reduce exposure to a further surge, but a full fix is not automatically appropriate for every organisation. The decision depends on renewal dates, consumption patterns, budget requirements, current contract terms and the level of volatility the organisation can absorb.
Staged purchasing, shorter contract periods or a combination of fixed and flexible volumes may be relevant in some cases. Energy-efficiency investment can also reduce exposure by lowering the volume purchased rather than attempting to predict the market.
Energy Matters Ireland reviews electricity and gas bills, renewal dates, contract structures and relevant energy-efficiency or grant opportunities.
Send us a recent electricity or gas bill and the renewal date for an assessment of the current market position and the options available.
The market is no longer pricing fuel alone. It is pricing whether one narrow waterway can remain commercially open.